MWS-Report
3.0. Chapter 3 – Evaluation of the Ecofish Research Ltd. Cumulative Effect Indexing Tool
3.1. Summary
Ecofish Research Ltd. developed a water quality cumulative effect indexing tool for NWT CIMP. This tool was developed to help select sites where water quality monitoring would be most beneficial to understanding cumulative effects to water quality in a given region. For the next three years (2020- 2022), NWT CIMP will use the tool for a research project monitoring cumulative effects to water quality in the Upper Coppermine River Basin. The project first uses the tool to categorize lakes in the Upper Coppermine as low, medium or high cumulative effect risk by combing several remote sensing metrics. Secondly, the tool uses the Halton Iterative Partitioning (HIP) method to remotely select lakes greater than 1km (so that they can be accessed and sampled in a float or ski plane) in length throughout the basin or sub-basin to be used in the monitoring program. Eventually, data from this three year water quality sampling program of 30 lakes in the Daring Lake sub-basin will be used to fully validate the tool. The first monitoring campaign took place in July 2020. The ultimate goal is a validated cumulative effect tool that can be applied across the Northwest Territories to efficiently determine where monitoring should be directed.
Prior to the monitoring campaign and collection of new water quality data, a first evaluation of the tool can be undertaken using existing data, the same data analysed in Section 2.0 of this report. These data were collected by Environment and Natural Resources – Water Management and Monitoring Division (ENR-WMMD) for their long term water quality network. Sites used in this evaluation are Daring Lake, Desteffany Lake and Lac de Gras. Observed data from these sites can be compared against the tool’s prediction. Rocknest Lake was not used in the evaluation because it is outside of the cumulative effect indexing tool’s borders.
Results from the tool predict low cumulative effect risk for Desteffany and Daring Lake and high risk for Lac de Gras. The tool also predicts low risk in all natural disturbance metrics in all three lakes, except for a medium water area change at Lac de Gras. Most of the risk comes from anthropogenic disturbance. The observed results echo the tools predictions such that Lac de Gras shows the most consistent change in parameters over the last 20 years in parameters constant with anthropogenic disturbance. Desteffany Lake is rated low due to its high flushing rate, however, the observed data would suggest a medium risk based on its significant increasing trends. Future recommendations for the tool would be adding a permafrost slump metric to the natural disturbance category and looking into the application of the vulnerability category.
3.2. Development of the site selection tool
The cumulative effect indexing portion of the tool was developed by Ecofish using publicly available GIS data layers (Ecofish, 2020). It uses cumulative effect (CE) metrics from three categories. Natural disturbances include wetting and drying indices, greening and browning indices, and total absolute water surface area change. Anthropogenic disturbances include, distance downstream from disturbance, disturbance footprint density and road density. Finally, landscape vulnerability was determined using a flushing rate index, which is the ratio of lake surface area to contributing area.
The greening and browning index is a measure of long term rates of greening or browning using Landsat 5 imagery (Normalized Difference Vegetation Index (NDVI) trends) from 1985-2010. The wetting and drying uses the same methodology as greening and browning, however, Normalized Difference Water Index (NDWI) is used instead. Water change percentage uses Landsat data from 1985-2010 sourced from the Global Water Surface Explorer. It compares the area of the changed area against the entire area of the basin. Therefore, a high value indicates a larger disturbed area, most likely caused by a natural disturbance. The disturbance footprint measures the area of anthropogenic disturbance (ex. mine sites) in the upstream drainage area compared to the total basin area. The road density metric measures road length in the upstream drainage area and divides this by the total basin drainage area. Vulnerability was determined based on the lake size, compared to the upstream drainage area. It is based on the idea that smaller lakes will be flushed and larger lakes will take longer to expel contaminants.
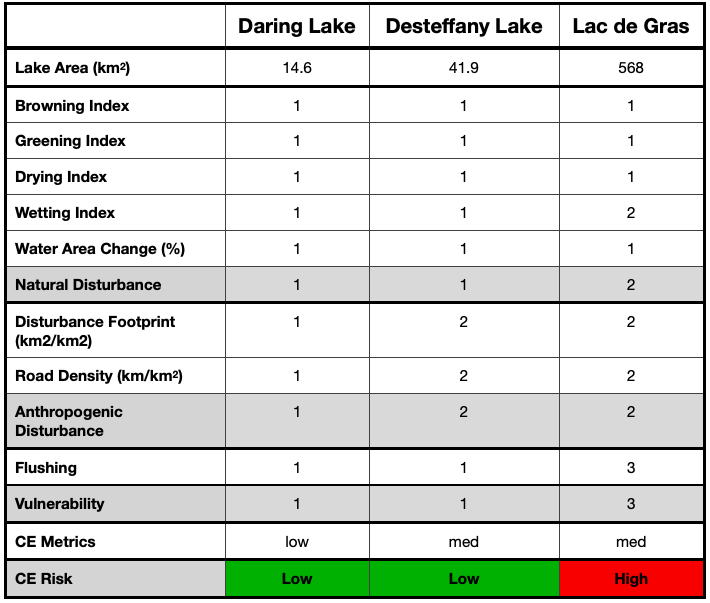
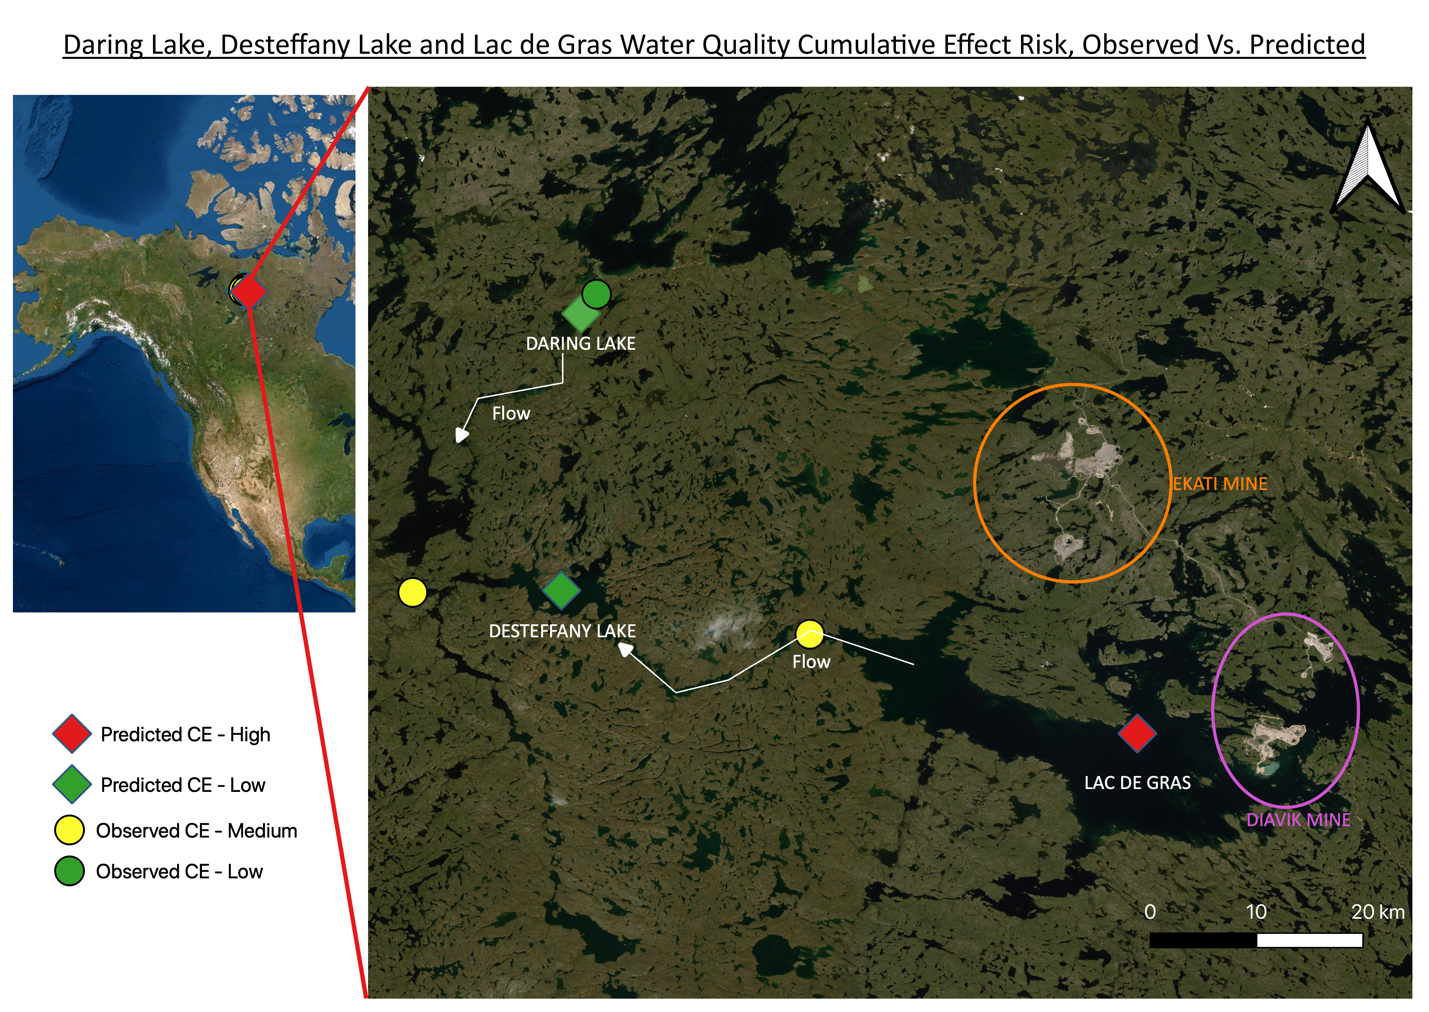 **Figure 10.** Observed vs. predicted cumulative effects to water quality at Daring Lake, Desteffany Lake and Lac de Gras. Observed symbols are
reflective of the actual sampling location.
Furthermore, similar to the tool, the most significant increasing trends in parameters reflect
anthropogenic activity in the basin (strontium and conductivity) such as diamond mining and road
building. Strontium increased by 223% at Lac de Gras and 103% at Desteffany. Conductivity increased
by 94% at Lac de Gras and 45% at Desteffany.
**Figure 10.** Observed vs. predicted cumulative effects to water quality at Daring Lake, Desteffany Lake and Lac de Gras. Observed symbols are
reflective of the actual sampling location.
Furthermore, similar to the tool, the most significant increasing trends in parameters reflect
anthropogenic activity in the basin (strontium and conductivity) such as diamond mining and road
building. Strontium increased by 223% at Lac de Gras and 103% at Desteffany. Conductivity increased
by 94% at Lac de Gras and 45% at Desteffany.
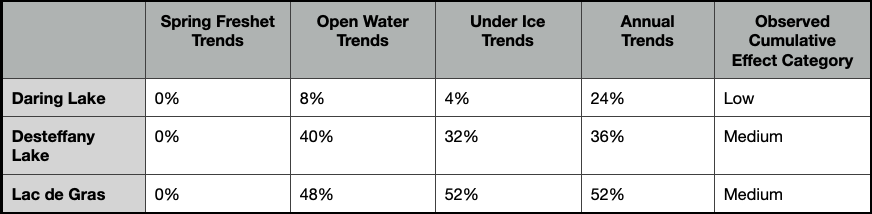 **Table 9.** Percent of significant trending parameters at Daring Lake, Desteffany Lake and Lac de Gras from section 2.0.
**3.5. Discussion and Conclusion**
The results from the cumulative effect index tool developed by Ecofish Research Ltd. produces similar
results to the analysis of nearly 20 years of water quality data at Daring Lake, Desteffany Lake and Lac
de Gras. Lac de Gras and Desteffany show higher cumulative effects, mainly contributed by
anthropogenic disturbance in their sub-basin. The actual data supports the tool’s interpretation of
Desteffany Lake and Lac de Gras with a high number significant temporal trends and significant
increases in anthropogenic related parameters, such as strontium and conductance. Daring Lake is
predicted to have a low cumulative effect risk and its baseline data supports this with few temporal
trends and a lack of changing anthropogenic related parameters.
As outlined in Ecofish Research Ltd’s report, future work with the tool should include layers that
address permafrost thaw, slumping, and forest fires in the natural disturbance section and land cover
and surficial geology in the landscape vulnerability section (Ecofish et al., 2020). Considering that
section 1.0 of this report highlighted the significant effect geology, slumping, and forest fires can have
on water quality in the north, the tool should especially consider these. For example, the water
quality data showed significant increase in sodium (an indication of slumping) at Lac de Gras (419%)
and Desteffany Lake (174%) but is not directly accounted for by any of the tool’s layers. A more robust
surficial analysis by the tool may be helpful in teasing out sources of existing water quality
disturbances. Overall, the preliminary analysis of the cumulative effect index tool based on existing
water quality data shows agreement with observed data and potential as an effective predictive tool.
Moving forward, the three year sampling program in the Daring Lake sub-basin will help perfect this
tool further.
[Index](/MWS-Report/)
**Table 9.** Percent of significant trending parameters at Daring Lake, Desteffany Lake and Lac de Gras from section 2.0.
**3.5. Discussion and Conclusion**
The results from the cumulative effect index tool developed by Ecofish Research Ltd. produces similar
results to the analysis of nearly 20 years of water quality data at Daring Lake, Desteffany Lake and Lac
de Gras. Lac de Gras and Desteffany show higher cumulative effects, mainly contributed by
anthropogenic disturbance in their sub-basin. The actual data supports the tool’s interpretation of
Desteffany Lake and Lac de Gras with a high number significant temporal trends and significant
increases in anthropogenic related parameters, such as strontium and conductance. Daring Lake is
predicted to have a low cumulative effect risk and its baseline data supports this with few temporal
trends and a lack of changing anthropogenic related parameters.
As outlined in Ecofish Research Ltd’s report, future work with the tool should include layers that
address permafrost thaw, slumping, and forest fires in the natural disturbance section and land cover
and surficial geology in the landscape vulnerability section (Ecofish et al., 2020). Considering that
section 1.0 of this report highlighted the significant effect geology, slumping, and forest fires can have
on water quality in the north, the tool should especially consider these. For example, the water
quality data showed significant increase in sodium (an indication of slumping) at Lac de Gras (419%)
and Desteffany Lake (174%) but is not directly accounted for by any of the tool’s layers. A more robust
surficial analysis by the tool may be helpful in teasing out sources of existing water quality
disturbances. Overall, the preliminary analysis of the cumulative effect index tool based on existing
water quality data shows agreement with observed data and potential as an effective predictive tool.
Moving forward, the three year sampling program in the Daring Lake sub-basin will help perfect this
tool further.
[Index](/MWS-Report/)